There are various technical indicators that can be implemented by the technical analysts in order to find exclusively unique opportunities in stock trading by generating intraday stock future calls. However, all indicators have different theories and are implemented in their own way.
The technical indicators are implemented by the industry experts to trade efficiently and improve performance in trading. Initially, implementing a technical indicator can be a tough job but slowly and gradually, you can learn which technical indicator works for which trading style. All the technical indicators are classified into four categories. They are momentum, trend, volatility, and volume.
In this post, you will get to learn about the types of technical indicators with examples.
- Momentum Indicators

The momentum indicator is used to compare the prices over time. Thus it is useful for traders to recognize the pace of price movements. This technical indicator is also implemented many times to evaluate the volume of assets. However, it is mainly applied to the price of the stocks. The momentum indicator is estimated by matching up the prior closing prices of the stocks to the current closing prices. It emerges as a line below a price chart swinging as momentum changes.
Future price is signified as a divergence between price and a momentum indicator. Some of the examples of momentum indicator are Momentum, Relative Strength Index (RSI) and Stochastic. The strong buying possibilities are predicted by prices making lower lows.
2 Trend Indicators
Like the name, trend indicator is used to predict the trend of the market. In the stock market, it is difficult to distinguish that the market trend is bullish or bearish from oscillations and noise of the market. The nature of the market is the up and down swings.
To forecast this nature, whether the market is bullish or bearish, the trend indicators are implemented. To measure direction and strength of a trend, this indicator is used. Trend indicator makes use of price average and establishes a baseline. The market is bullish uptrend when the price progresses above the average and vice versa. The market is bearish downtrend when prices drop below the average.
3 Volatility Indicators
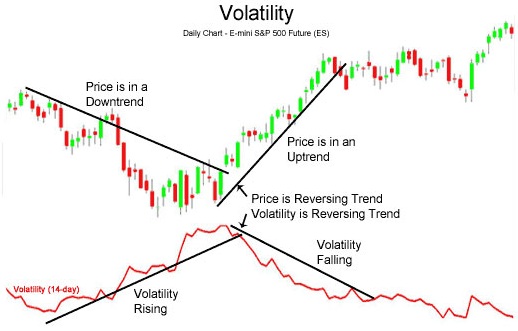
In technical terms, volatility can be defined as the measurement of the combination of the amount and the speed of price swinging up and down. Without considering the direction the volatility indicator evaluates the speed of price moments. Volatility indicators are derivative from the highest and lowest historical prices of financial instruments. Based on the study of volatility indicators, technical analysts decide the range of buying and selling of stocks.
4 Volume Indicators
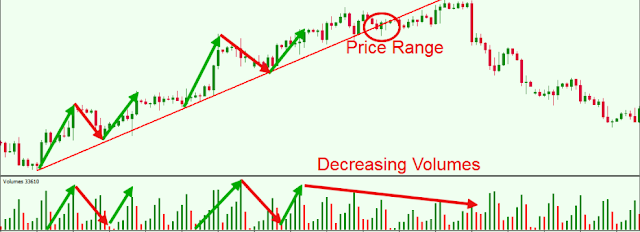
Irrespective of the prices of the stock the volume indicator represents the total number of trading activities that take place during a particular interval. The volume indicators are similar to trending indicators based on averaging and smoothing of raw volume. The trading direction is established as the volume levels shift above the average, which also indicates the strong trend. As the volume increases, the strongest trend is likely to occur, leading to large movements in price.
Using Indicators
The technical analysts consider on how the indicators work and in which market it has to be implemented effectively. Trading, on the other hand, is a game of correct timing. Thus you must find the best technical analysts, who are capable of finding the accurate intraday stock future calls. Money Classic Research offers stock option tips free trial so that you can check the legitimacy of the calls.
For More Details @https://moneyclassicresearch.org/


No comments:
Post a Comment